Amsterdecks (Liquid Commons)
Mock-ups/proto-prototypes: snelle hacks, uitprobeersels en mock-ups
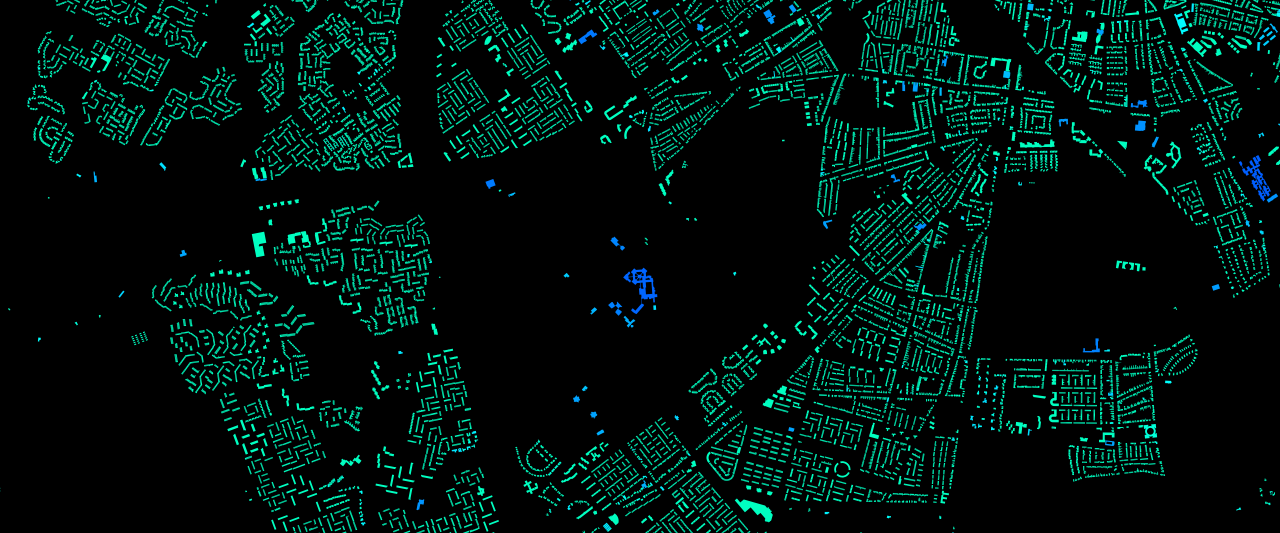
PUMA estimates the concentration of metals in residential buildings with open data. This creates a map from the perspective of a future circular economy—because “Cities are the mines of the future” (Jane Jacobs).

A data platform for administrative networks, functions and power. Transparent Netherlands wants to contribute to our democracy by making it more defensible and improving the information position of citizens.
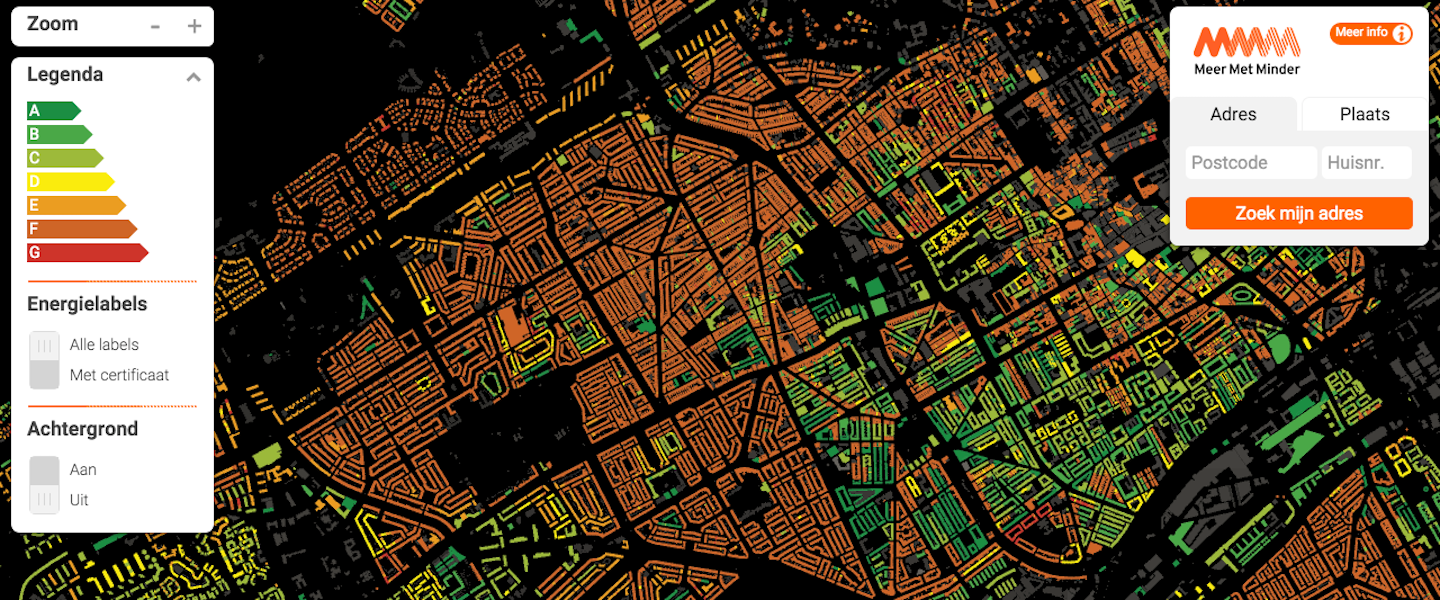
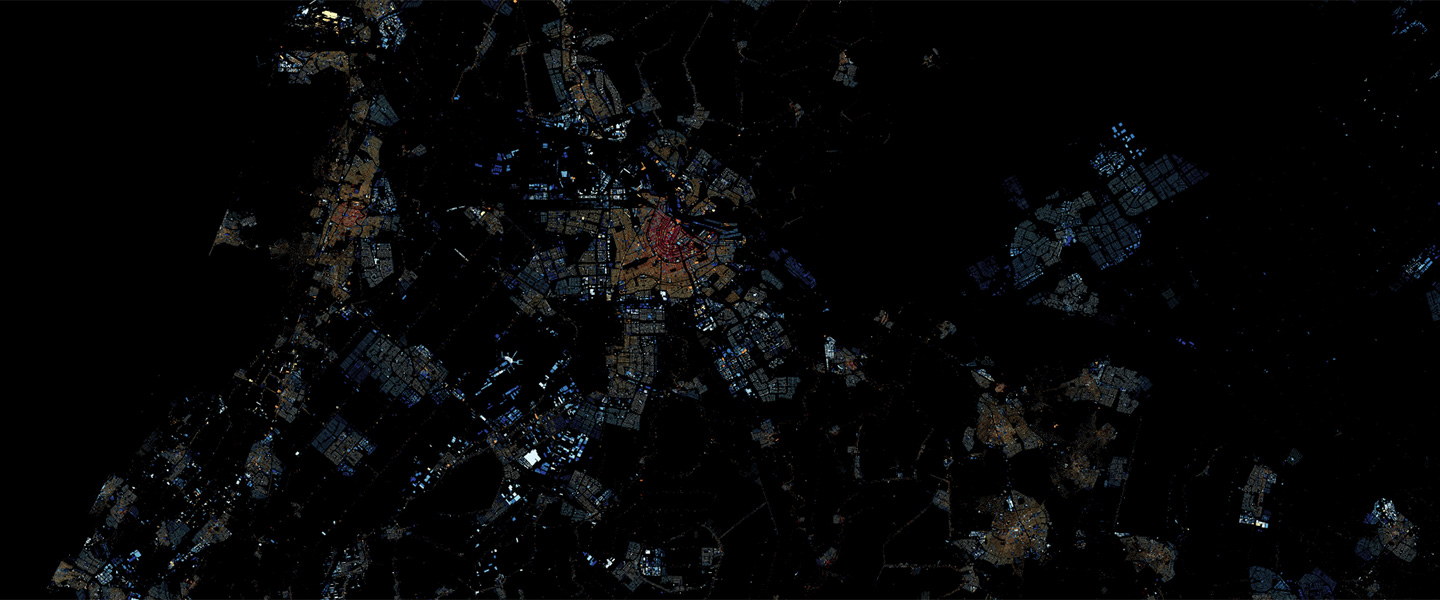
The Energy Label Atlas shows the energy labels of all houses in the Netherlands. When labels change, the server automatically updates the background map.

Clique is an application to research the political influence network of a politician from various angles. It visualizes the career of the selected person on a timeline. You can explore the changes in between two moments in time in the change visualization by selecting a period on the timeline. By selecting a person in the change visualization, you can review the commonalities between the two selected persons.
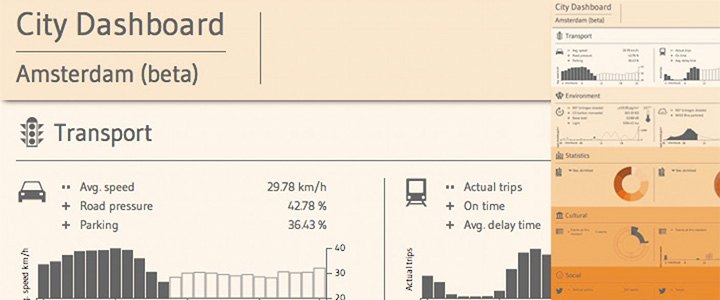
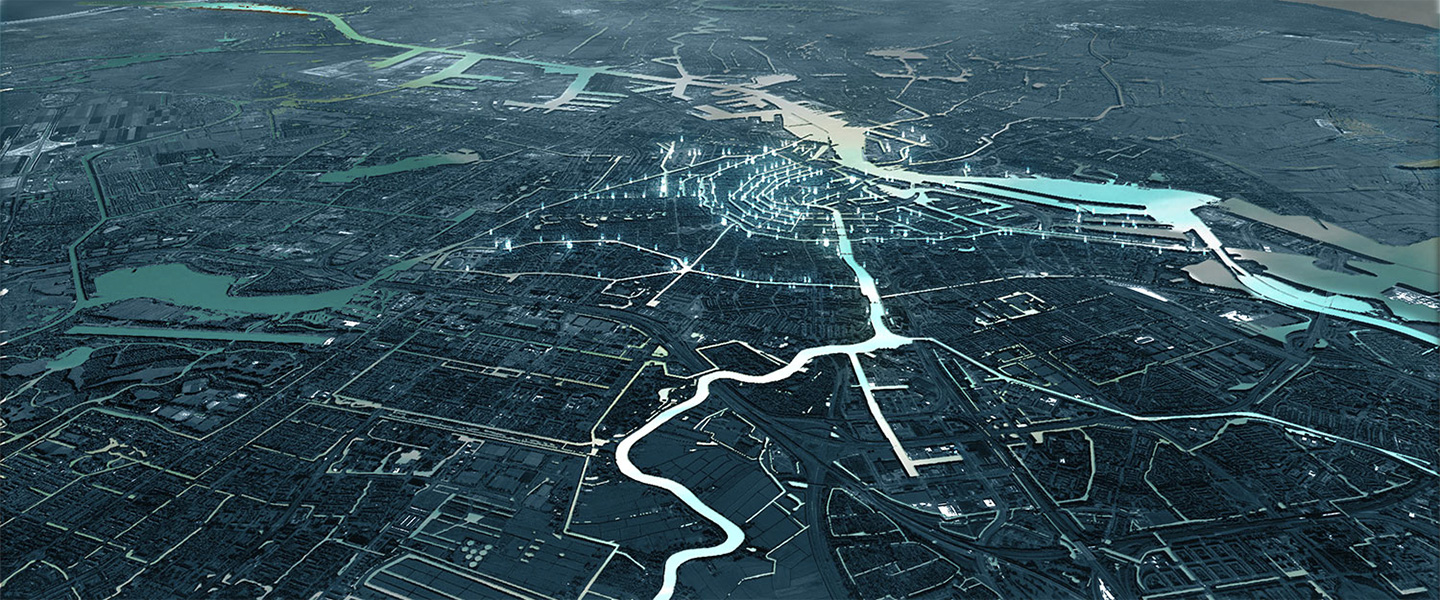
Currently under construction! At the Smart City Conference in May 2014, a beta version of the City Dashboard Amsterdam was presented, that showed realtime data from the city.
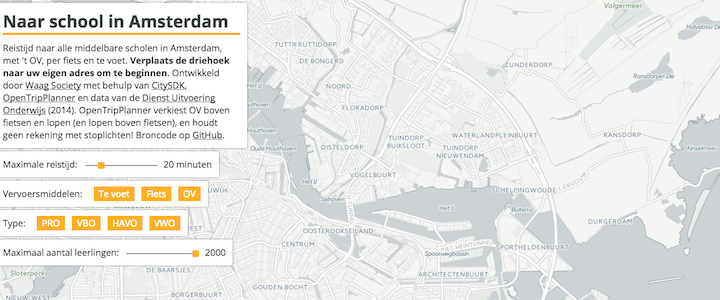
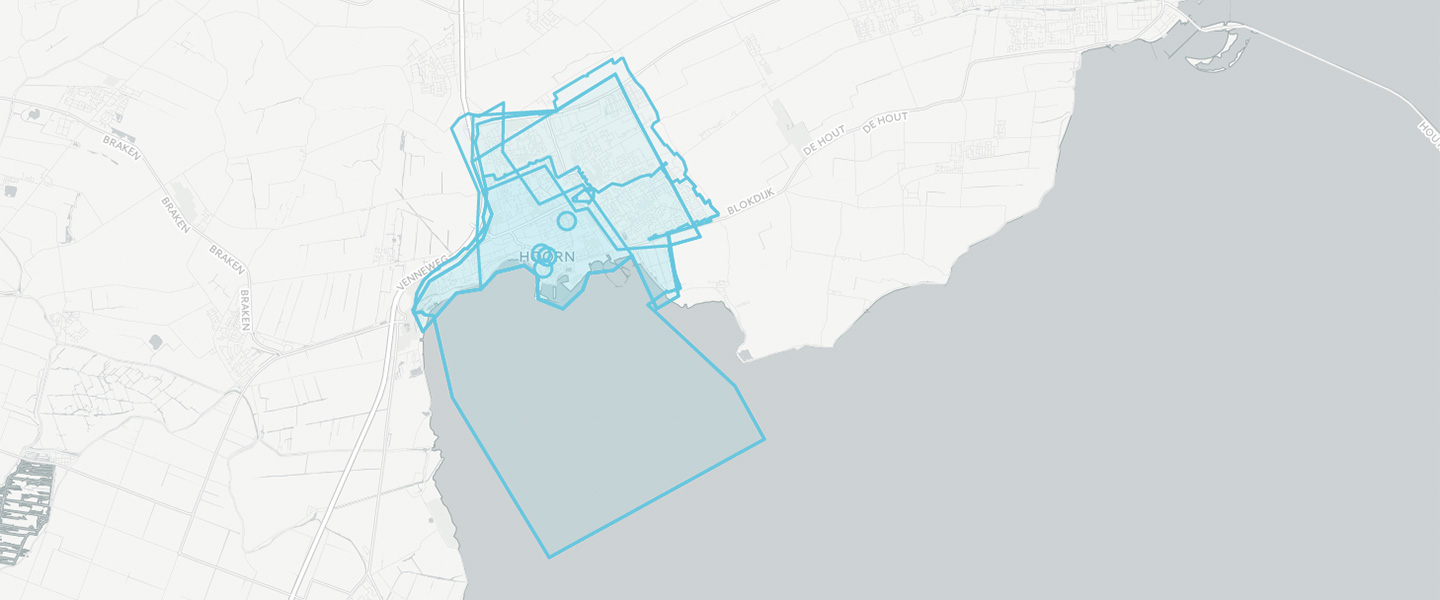
Working prototype for school selection based on multimodal travel distance, quality, size and other attributes. Combines open source cartography/trip planning/school data. Currently a mock-up.
Want to learn how to make beautiful maps? Let's do it together! Beginners very welcome!
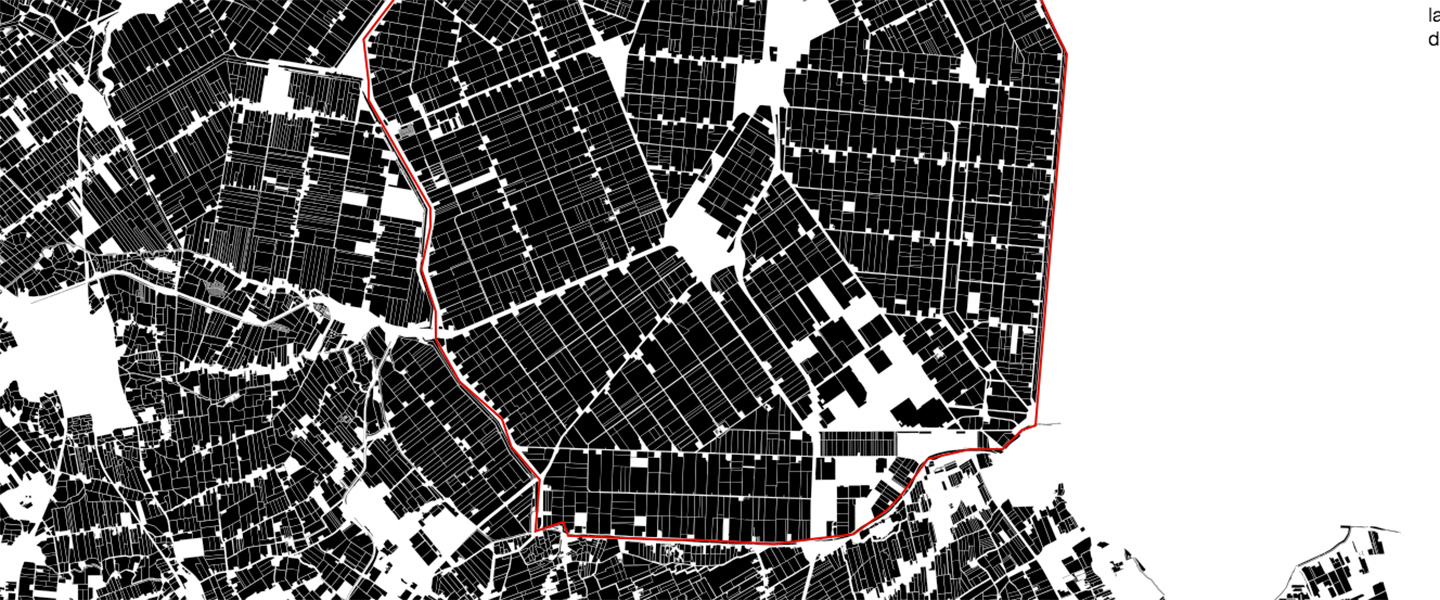
Visualisation of the way agriculture has determined the lay-out and shape of the Dutch landscape after 1945. For the exhibition 'Mansholt, Landscape in Perspective', 18 January - 6 April 2014, Bureau Europa, Maastricht.
A historical geocoder for search and standardization of place names throughout history. Enables geographical search in cultural heritage collections.
Quick mock-up of an app calculating traffic flow for big scale building projects.